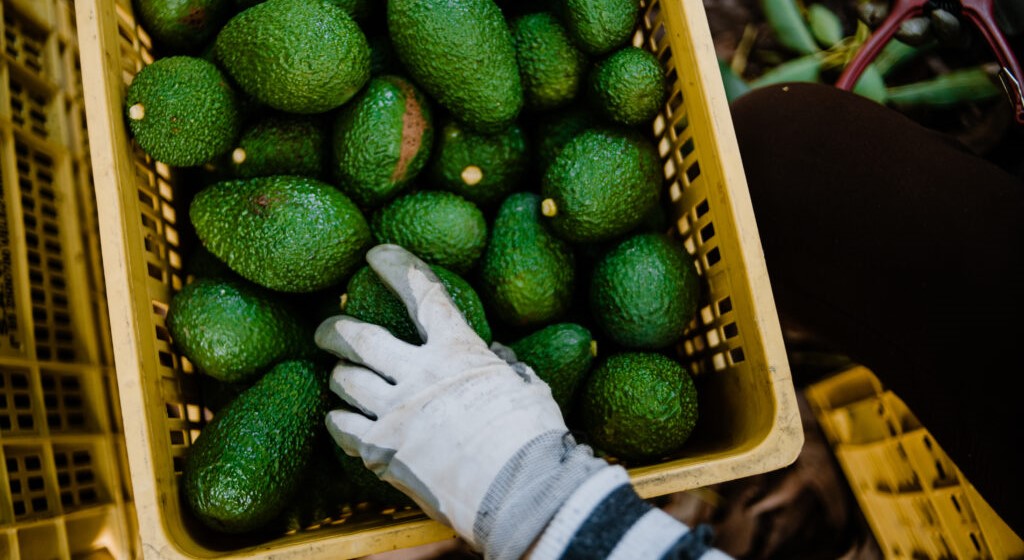
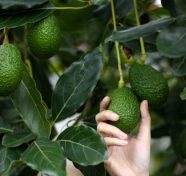
In this installment of the ‘Agronometrics In Charts’ series, Sarah Ilyas studies the state of the Colombian avocado season. Each week the series looks at a different horticultural commodity, focusing on a specific origin or topic and visualizing the market factors that are driving change.
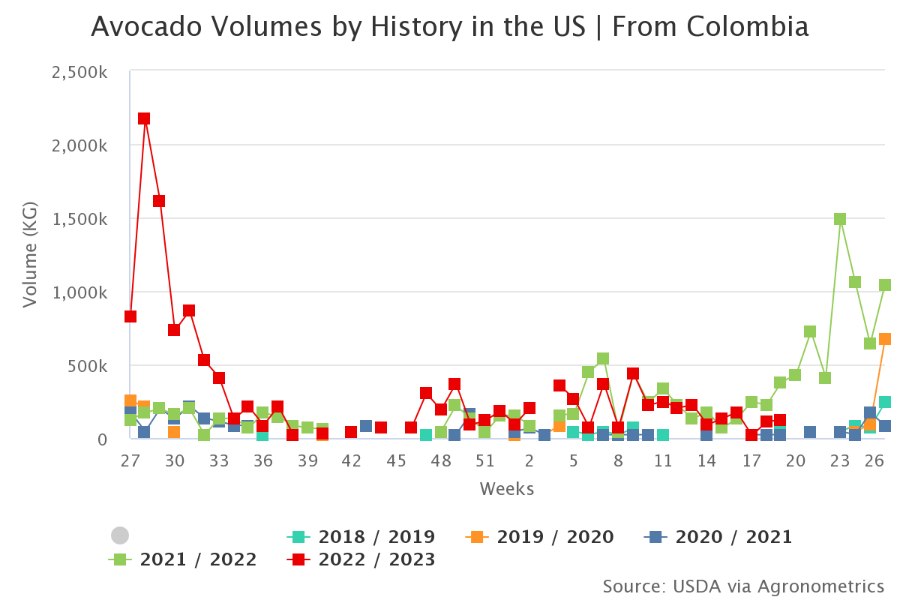
The Colombia Avocado Board (CAB) has reported a significant increase in the volume of Colombian avocados being shipped to the United States this season, with a remarkable surge of 104% compared to the corresponding period of the previous year.
This rise in avocado production and orchard development has been a rapid and notable phenomenon over the past two years. In 2021, a total of 150 orchards yielded just under 6.5 million pounds of avocados. Presently, the number of orchards has escalated to 488, spread across eight states, resulting in substantial production of nearly 25 million pounds during the ongoing 2023 season.
This noteworthy increase of 325% since 2021 showcases the remarkable growth of this sector.
“We have a great advantage over other countries because we produce avocado at different heights, more or less between 1,700 and 2,500 meters above sea level, which allows us to have fruit all year round,” says Jorge Restrepo, the president of CorpoHass.
“Our ability to ship directly to the US, one of the strongest avocado consumption markets in the world, is a great asset to Colombia avocados suppliers, but also an opportunity for American consumers as they have more supply choices to meet their growing demand,” says William Watson, the CAB’s managing director. Although Colombia has produced and distributed avocados for years, CAB’s alliance with the US market has greatly expanded the company’s infrastructure.
“Colombian avocados are a tropical avocado grown in tropical rainforest regions of the Andes, allowing producers to rely on Mother Nature,” says William Watson, who indicated the climate translates to a lighter environmental footprint for cultivating avocados. Watson further noted that many of the regions that were impacted by Colombia’s civil conflicts over the years, are now prime avocado-growing regions.
“The avocado industry has allowed for the rebuilding of community and regional infrastructure, including roads and hospitals,” he said. “And the avocado industry provides many jobs that create a sense of pride and allows people to return to a region they once fled from, and [for which they can] once again feel country pride.”
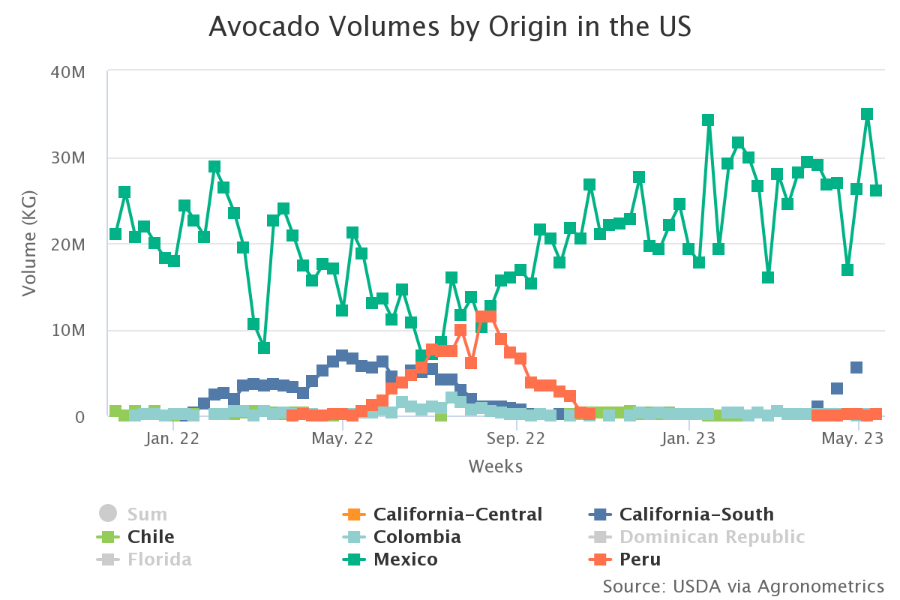
A review of USDA data shows that in the last 5 years (2018-2022), the United States has imported more than 26,000 metric tons of Colombian avocados. Although this quantity appears minimal when juxtaposed with the primary exporters, namely Mexico, Peru, and the Dominican Republic, it does, nonetheless, signify noteworthy prospects within the realm of marketing for Colombian avocados.
FAOSTAT data indicate that Colombia is the second-largest producer of avocados, yet it ranks sixth in terms of exports. Given the significant increase in the consumption of this fruit globally, the Colombian avocado industry has a great opportunity to grow its export market.
To take advantage of this opportunity, it is imperative for Colombian avocado cultivators to allocate resources towards technological advancements and impart comprehensive training to enhance both the caliber and output of their crops. Furthermore, the nation should prioritize the exportation of avocados of superior quality that align with prevailing international standards.
In our ‘In Charts’ series, we work to tell some of the stories that are moving the industry. Feel free to take a look at the other articles by clicking here.
All pricing for domestic US produce represents the spot market at Shipping Point (i.e. packing house/climate-controlled warehouse, etc.). For imported fruit, the pricing data represents the spot market at the Port of Entry.
You can keep track of the markets daily through Agronometrics, a data visualization tool built to help the industry make sense of the huge amounts of data that professionals need to access to make informed decisions. If you found the information and the charts from this article useful, feel free to visit us at www.agronometrics.com where you can easily access these same graphs, or explore the other 21 commodities we currently track.

